Overview
VSCode is a fantastic IDE for editing <insert your favourite language here> source code. Likewise Angular is a great framework for developing front-end web apps.
When developing applications, we developers usually spend most of our time in the debugger. However, out of the box there is a little bit of setup required to enable debugging of an Angular TypeScript application when using VSCode.
In this post I’ll show you how to configure VSCode debugging for an Angular TypeScript application with the Google Chrome web browser.
The Pre-Amble …
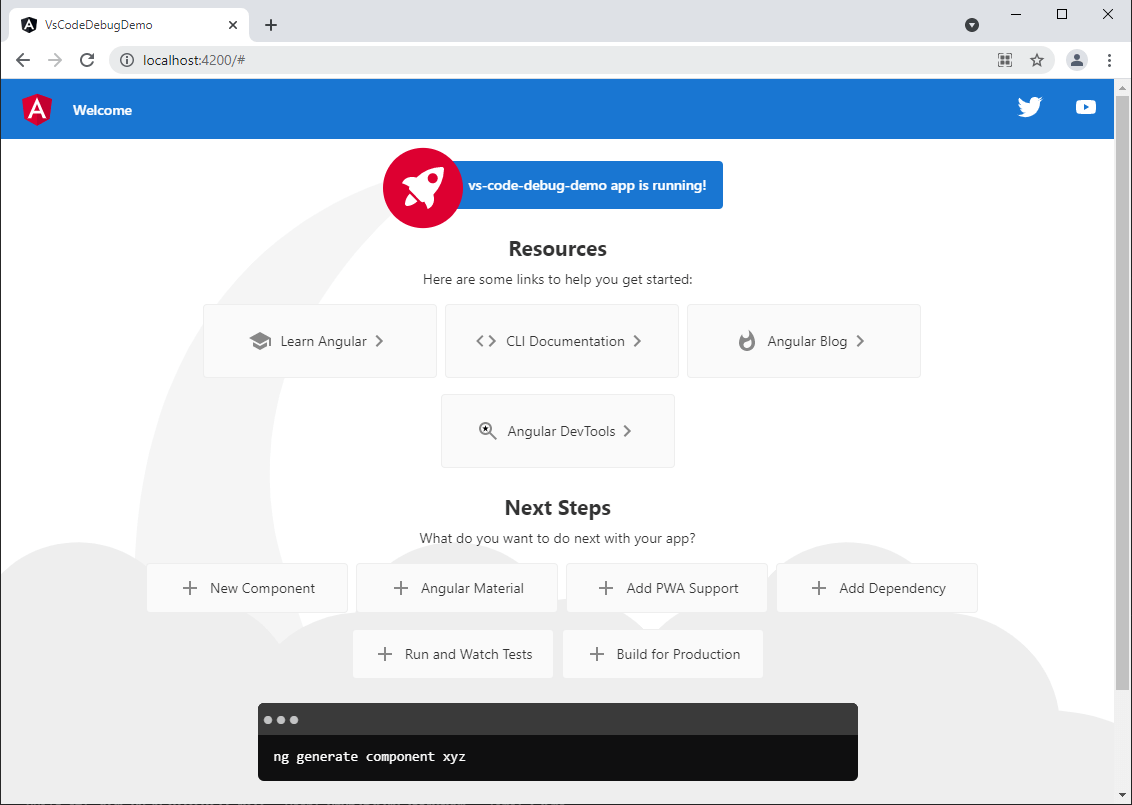
For the purposes of this article I will create a dummy Angular web app using the following Angular CLI command:
ng new vs-code-debug-demo

Step-by-Step Guide
Now we need to configure VSCode to enable debugging. The process is as follows.
1. First, replace the .vscode/launch.json file with the following content. If this file doesn’t exist, then create it.
Ideally your application should be in the same root directory, and not nested in sub-folders, otherwise you will need to amend the ‘webRoot’ path e.g. ‘${workspaceFolder}/my-nested-app-files’.
{
    "version": "0.2.0",
    "configurations": [
      {
        "name": "ng serve",
        "type": "pwa-chrome",
        "request": "launch",
        "preLaunchTask": "npm: start",
        "url": "http://localhost:4200/#",
        "webRoot": "${workspaceFolder}",
        "sourceMapPathOverrides": {
          "webpack:/*": "${webRoot}/*",
          "/./*": "${webRoot}/*",
          "/src/*": "${webRoot}/*",
          "/*": "*",
          "/./~/*": "${webRoot}/node_modules/*"
        }
      }
    ]
  }
2. Add the following task to your tasks.json file with the following configuration.
{
    "version": "2.0.0",
    "tasks": [
      {
        "type": "npm",
        "script": "start",
        "isBackground": true,
        "presentation": {
          "focus": true,
          "panel": "dedicated"
        },
        "group": {
          "kind": "build",
          "isDefault": true
        },
        "problemMatcher": {
          "owner": "typescript",
          "source": "ts",
          "applyTo": "closedDocuments",
          "fileLocation": [
            "relative",
            "${cwd}"
          ],
          "pattern": "$tsc",
          "background": {
            "activeOnStart": true,
            "beginsPattern": {
              "regexp": "(.*?)"
            },
            "endsPattern": {
              "regexp": "Compiled |Failed to compile."
            }
          }
        }
      }
    ]
  }
3. That’s it. We’re all done! Now it’s time to start debugging.
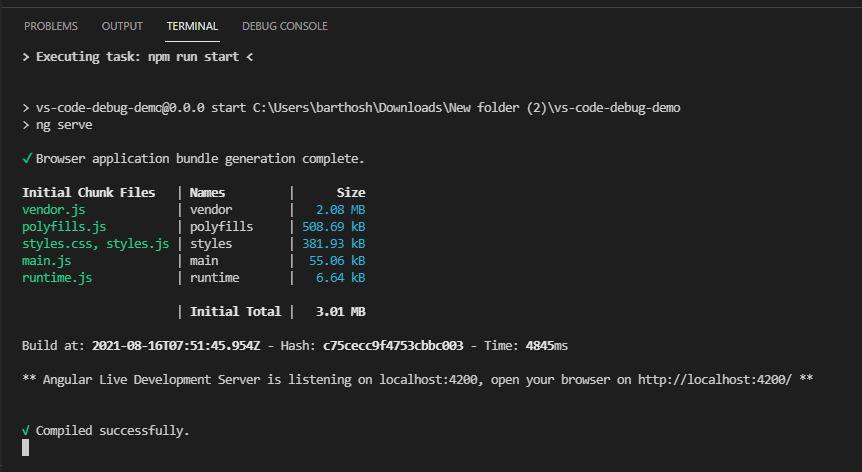
To start a debugging session, hit the F5 key or click RUN>START DEBUGGING and a terminal will open which will begin serving your web app, and a browser window will also open. Now if you add a breakpoint to your application code, you will be able to step through the code.

Source Code
You can find sample code for the above example at the below link, including configuration files.
https://github.com/sbartholomeusz/vscode-debug-demo
Final Thoughts
Well I hope this article has helped you configure VSCode for debugging your Angular Typescript web application.
If you have any thoughts or other alternative ways, feel free to share them in the comments below to help others out there. Happy coding 🙂
- Solved: Filename too long for Git - 18th April 2025
- GitHub Actions Exam Study Guide - 14th February 2025
- Solved: Build Errors Not Showing in VS 2022 - 21st November 2024

Very Good Instruction for Debugging. It worked for me.
Thanks for this, worked great.
When I stop the debug the browser is closed but not the ng server, is there a way to shut it down on stop?